Profiling Methods
![]()
vLLM-MindSpore Plugin supports the mindspore.Profiler module to track the performance of workers in vLLM-MindSpore Plugin. User can follow the Collecting Profiling Data section to gather data and then analyze it according to Analyzing Profiling Data. Additionally, user can inspect the model's IR graph through Graph Data Dump to analyze and debug the model structure.
Collecting Profiling Data
To enable profiling data collection, user needs to set the VLLM_TORCH_PROFILER_DIR environment variable to the directory where the profiling results will be saved. For multi-machine inference, this variable must be set on each machine before inference:
export VLLM_TORCH_PROFILER_DIR=/path/to/save/vllm_profile
After setting the variable, run the following command to launch the vLLM-MindSpore Plugin service. We take Qwen2.5-32B as an example:
export TENSOR_PARALLEL_SIZE=4
export MAX_MODEL_LEN=1024
vllm-mindspore serve Qwen/Qwen2.5-32B-Instruct --trust_remote_code --tensor-parallel-size $TENSOR_PARALLEL_SIZE --max-model-len $MAX_MODEL_LEN
If the service starts successfully, you will see output similar to the following, indicating that the start_profile and stop_profile requests are being monitored:
INFO 05-15 12:03:07 [launcher.py:31] Route: /start_profile, Methods: POST
INFO 05-15 12:03:07 [launcher.py:31] Route: /stop_profile, Methods: POST
INFO: Started server process [212135]
INFO: Waiting for application startup.
INFO: Application startup complete.
Once the service is running, user can send the following requests to perform a profiling collection:
# Request to start profiling
curl -X POST http://127.0.0.1:8000/start_profile

# Request for inference
curl http://localhost:8000/v1/completions \
    -H "Content-Type: application/json" \
    -d '{
        "model": "Qwen/Qwen2.5-32B-Instruct",
        "prompt": "San Francisco is a",
        "max_tokens": 7,
        "temperature": 0
    }'

# Request to stop profiling
curl -X POST http://127.0.0.1:8000/stop_profile
When the log displays content similar to the following, it indicates that profiling data collection for one worker is complete:
Parsing: [####################] 3/3 Done
Analyzing Profiling Data
The directory specified by VLLM_TORCH_PROFILER_DIR contains the profiling results, with subdirectories named with the ascend_ms suffix. Each subdirectory stores the profiling results for one worker. The files in these subdirectories can be referenced for performance analysis, as described in Ascend Performance Tuning.
User can select a subdirectory to analyze the performance of a single worker:
op_statistic.csv: Overall operator statistics.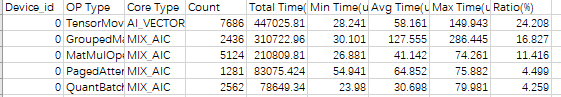
kernel_details.csv: Detailed execution data for each operator.
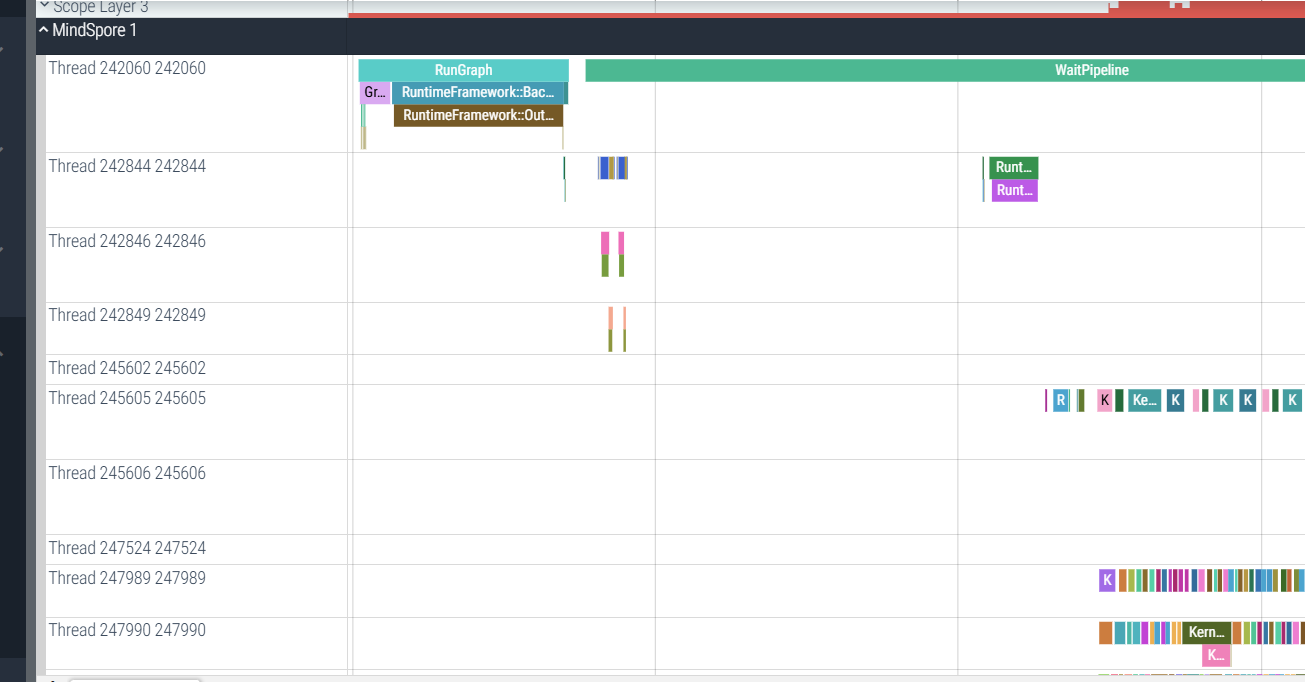
trace_view.json: System-wide execution data. This file can be uploaded to the Perfetto UI for visual inspection of system execution. Clicking on a process in the left sidebar displays trace event information for all threads under that process: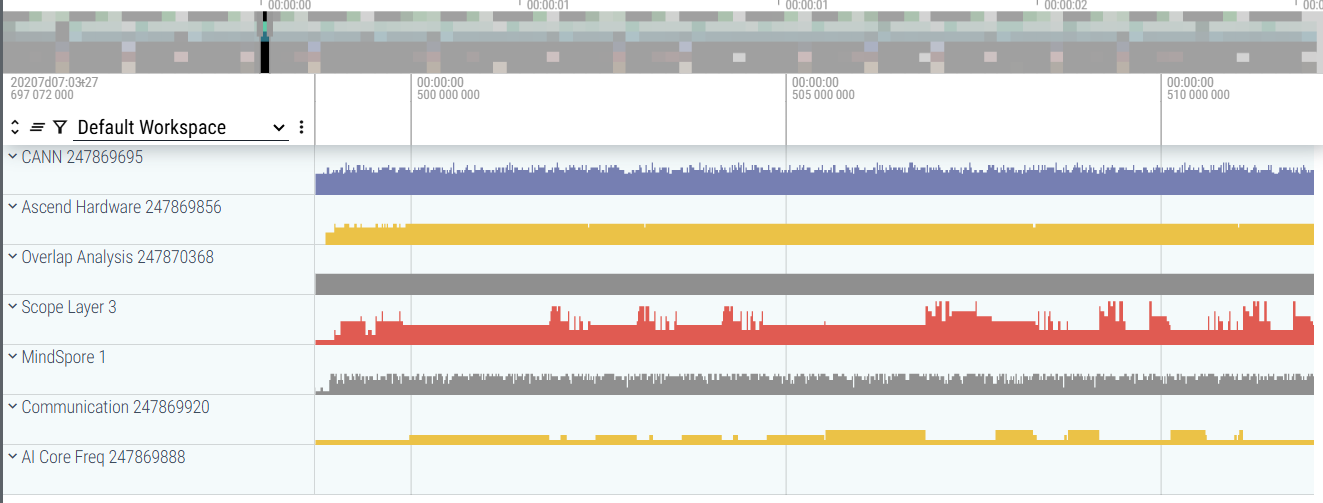
In MindSpore information, it shows the operator dispatch in graph execution.
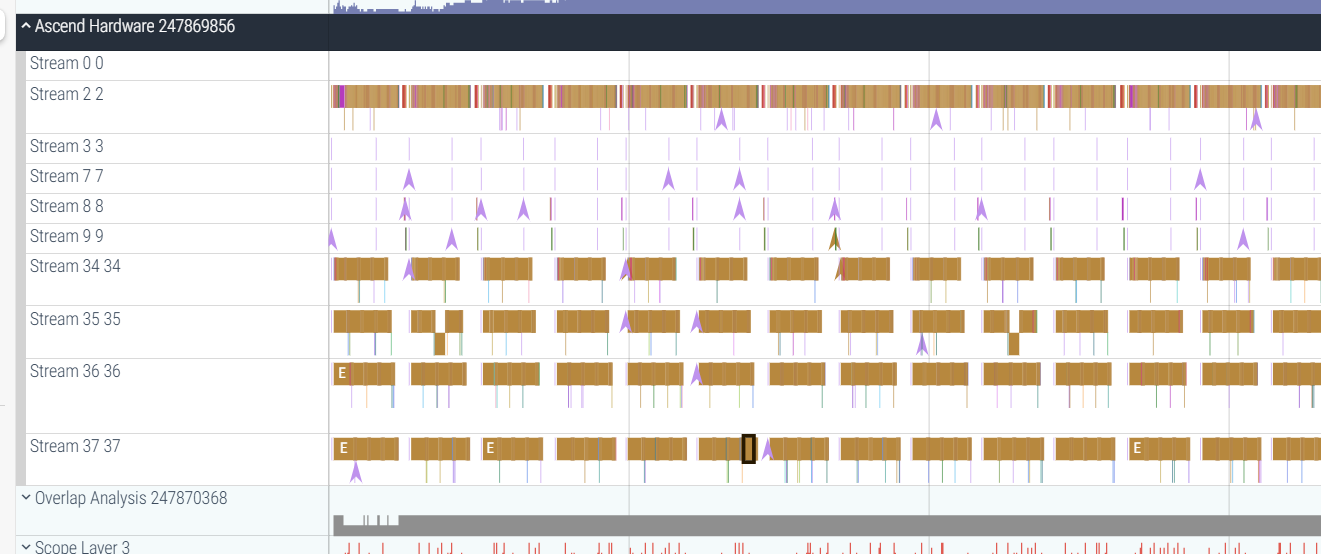
In Ascend information, it shows the actual execution of Ascend operators, which can be correlated with the operators dispatched in the MindSpore process.
Graph Data Dump
Refer to the MindSpore Dump Documentation. First, configure the JSON file, then set the MINDSPORE_DUMP_CONFIG environment variable to point to the absolute path of this configuration file. After inference completes, the graph data can be obtained.
The dump results include the IR graph. Additionally, by configuring the dump_mode in the JSON file, user can choose to dump execution data for all operators or specific operators.