Project Introduction — Third-Prize Solution for MindSpore-based Kidney-Tumor Segmentation
Project Introduction — Third-Prize Solution for MindSpore-based Kidney-Tumor Segmentation
The 10th CCF Big Data & Computing Intelligence Contest (2022 CCF BDCI) has recently come to a close with great success. The winning teams' solutions will be shared on the official competition platform, DataFountain (DF), for further communication and discussion. This blog presents one of the solutions for MindSpore-based Kidney-Tumor Segmentation, which won third prize in the contest. For details about the contest, visit http://go.datafountain.cn/3056.
1. Team Introduction
1.1 Team Name
MPLab, short for Multimedia Processing Laboratory.
1.2 Team Members
MPLab was established by students from Beihang University, who specialize in image segmentation, object detection, image enhancement, and medical operation data mining. The team members are as follows:
Li Hao (team leader): a postgraduate in the Electronic Information Engineering department, specializing in image segmentation and few-shot learning.
Huang Yunmeng: a postgraduate in the Electronic Information Engineering department, specializing in image segmentation and medical operation data mining.
1.3 Award
Third prize
1.4. Project Summary
Automatic segmentation of kidney tumors from 3D CT images can assist doctors in devising diagnosis and treatment plans. Participants of the MindSpore-based Kidney-Tumor Segmentation contest are expected to create an efficient automatic segmentation tool and train it using the MICCAI KiTS19 Challenge dataset, so as to develop a solution that can be applied to actual kidney CT imaging practices. Given the context, the team proposed a two-stage hybrid tool for kidney-tumor semantic segmentation based on 3D U-Net and U-Net3+ and designed modules that are used to process 3D kidney CT scanning images. These modules are responsible for tasks such as data preprocessing, extraction of kidney region of interest (ROI), data augmentation, Hybrid-Dice loss, and prediction result post-processing. The solution, which underwent over two months of intense competition, achieved a ranking of third place with the accuracy of 0.7987 on the official CT test dataset.
2. Project Overview
According to a statistical report of the National Cancer Center (NCC) of China [2], about 4,060,000 new cancer cases and 2,410,000 new cancer deaths occurred in China in 2016. The incidence of kidney cancer was about 5.48/105, ranking 16th. An effective method for identifying lesions quantitatively is through the semantic segmentation of kidney tumors and host kidneys. However, its practical application is limited due to the requirement for a high-quality 3D segmentation method of the target structure, which must be manually generated. The recent years have witnessed the great development of deep learning-based 3D segmentation, which requires a large number of datasets for training. Nonetheless, an optimal method has not been proposed. With the aim to accelerate the development of reliable kidney-tumor segmentation methods, this contest provided 300 high-quality abdominal CT images of kidney cancer patients, 210 of which contained professional human-made annotations, for algorithm training and verification.
U-Net[4] and its variants have achieved great success in medical image segmentation. As one of the variants of U-Net, 3D U-Net[5] is widely used in the segmentation of brain and liver cancers. Inspired by this, we proposed a two-stage hybrid approach for kidney-tumor semantic segmentation to locate kidney ROIs and then finely segment kidney regions, which resulted in an outstanding segmentation effect on the provided dataset.
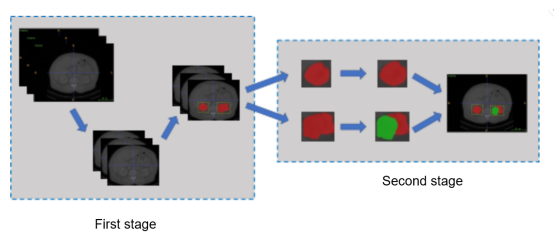
Figure 1 Structure of the two-stage hybrid method for kidney-tumor semantic segmentation
3. Project Details
The two-stage hybrid approach for kidney-tumor semantic segmentation consists of five parts:
1. Preprocess the original CT images and extract ROIs with effective responses to the organs as the training data.
2. Merge the kidney and tumor regions in the labels and perform a rough segmentation on the merged regions.
3. Analyze the rough segmentation results and extract the kidney ROIs as the data for fine segmentation.
4. Perform fine segmentation on kidney and tumor regions based on the kidney ROIs. 5. Postprocess the model prediction data, pad small holes in the prediction results, and move irrelevant small objects.
The steps 1 and 2 form the first stage (kidney segmentation), and the steps 3, 4, and 5 form the second stage (kidney and tumor segmentation). The models in steps 2 and 4 are trained from scratch, and 5-fold cross-validation is used to ensure model effectiveness.
Data Preprocessing
The CT image volume is fixed, that is, the intensity of images scanned by different scanners or hospitals for the same organ is the same. Therefore, during preprocessing, the value of each image pixel in the dataset is cropped to [–79, 304], to ensure that responses to a specific organ are retained while irrelevant range values are removed from images. To save storage space, we mapped the value range of [-79, 304] to [0, 255] and stored data in uint8 format. After data calculation, we obtained an average value 119.84 and a variance 103.80, both of which are used for normalization of image values during training.
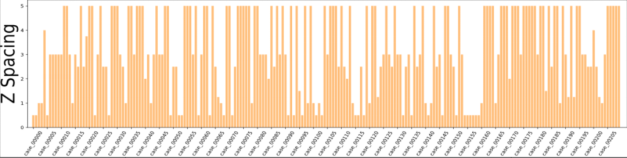
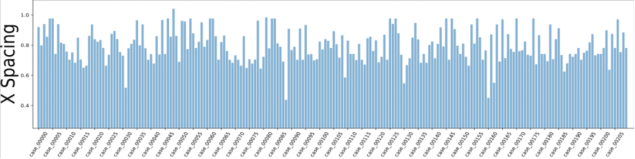
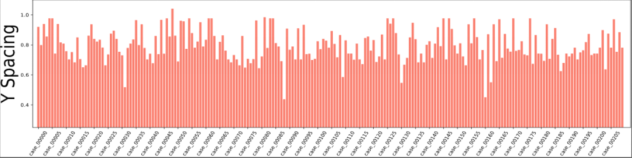
Figure 2 Voxel spacing of CT images in the dataset
According to the dataset analysis, a large black border that is irrelevant to organ segmentation exists in each image, which reduces the proportion of pixels in the effective organ response region. To address this problem, we extracted effective response ROIs [6] of organs after performing the first two steps. As shown in Figure 2, the voxel spacings of images in the dataset are not evenly distributed. That's because neural networks cannot automatically interpret voxel spacings, and all images need to be resampled to obtain the same voxel spacing. However, a small voxel spacing leads to a large size of images and insufficient memory resources, while a large voxel spacing reduces image resolutions causes detail losses. After analyzing the voxel spacing of each data record in the dataset and the balance of computation resources for training, we resampled the voxel spacing to 3.22 x 1.62 x 1.62 mm, and thus obtained images with 128 x 248 x 248 pixels. To facilitate training, we sampled images at spacings of 48, 44, and 44 on the z, x, and y axes and converted them into 80 x 160 x 160 training data.
Rough Segmentation of Kidney-Tumor Regions
To locate the kidney regions in the second phase, we used 3D U-Net to roughly segment the kidney-tumor regions. Simply put, we changed the tumor region marked as label 2 to label 1, and in this case, it can be regarded as a part of the kidney. Then, we used 3D UNe to perform binary classification between a kidney-tumor region and background. This step is for a rough location of kidneys, so no extra residual and attention modules are added. During the training, we set the batch size to 4 and the initial learning rate to 0.0003. After 1500 batches were trained, we set the learning rate to 0.001. Based on the cosine learning rate policy, we then set the learning rate to 0.00001 after 90 epochs. Due to the small proportion of the kidney-tumor regions in the images, we added the kidney-tumor Dice to the cross-entropy loss. The loss function is as follows:
loss=Dicekidney+tumor+lossce(pred,label) (1)
And the Dice is calculated as follows:
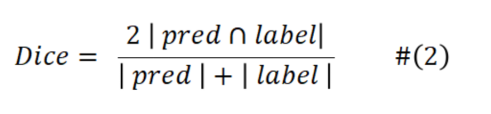
lossce indicates the cross-entropy loss, pred indicates the predicted value, and label indicates the actual label value.
In actual training, we used VNet[7] as a comparison algorithm to compare with 3D U-Net, and Table 1 lists the comparison result. VNet is slightly better than 3D U-Net in background segmentation, but 3D U-Net outperforms VNet in kidney-tumor segmentation. This discrepancy could be attributed to the fact that VNet's residual structures are not effectively leveraged due to the simplistic medical image content. Additionally, discrepancies in the features of the tumor and kidney may have contributed to VNet's increased tendency for misjudgment. In a nutshell, the performance of 3D U-Net is better than that of the VNet. That's why we chose 3D U-Net for kidney-tumor segmentation in the first phase.
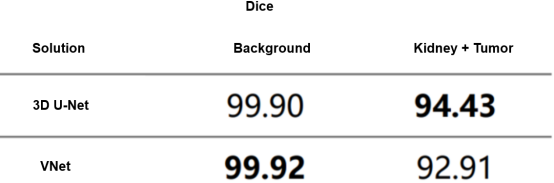
Table 1 Cross-validation results of kidney-tumor rough segmentation
Kidney ROI Extraction
Kidney ROI extraction refers to a process to locate kidney regions in the images. As shown in Figure 3, the total pixel number of the kidneys and tumors is far fewer than that of the background in the given dataset, and the distribution of each category is extremely unbalanced. To obtain higher segmentation accuracy, ROIs need to be cut off from the original images to reduce the background region and alleviate the impact caused by uneven distribution.
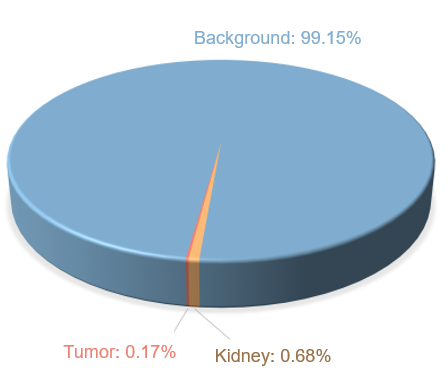
Figure 3 Distribution of raw data labels
In the actual extraction process, different schemes are adopted for training and inference. During training, the kidney ROIs are extracted based on the human-made labels of the training data, and the inference is performed based on the prediction results of the first phase. The method we proposed is to first calculate the sum of pixels in each dimension. The formula for training is as follows:
statz,x,y=sum(label,axis=z,x,y) (3)
statz,x,y indicates the total vectors accumulated on the z, x, and y axes. label indicates labels of the training data. axis=z,x,y indicates that the operation is performed on the z, x, and y axes. Similarly, the formula for inference is as follows:
statz,x,y=sum(pred,axis=z,x,y) (4)
pred indicates the prediction results in the first phase, and other values are the same as in the formula for training.
The background is labeled as 0 in the dataset. If we could determine the boundary of the non-zero region, we are able to locate the range of the kidney-tumor region in each dimension. Thanks to the high-quality labeling of the original dataset, the range accuracy of the kidney-tumor region is high during training. However, during inference, the obtained range is not accurate. This is because the ROIs are determined based on the kidney-tumor segmentation results in the first phase, and the obtained boundary needs to be redundant. To solve this issue, we designed a ROI extraction scheme with robustness for training and inference.
During inference, there are some small holes and objects (small connected regions of the kidneys and tumors) in the prediction results of the kidney-tumor region in the first phase. Small holes in big connected regions have small effects on ROI extraction in each dimension but small objects heavily affect the extraction process. Ideally, statz, x, and y are transmitted from the all-background region 0 in each dimension to non-0 regions, and then to all-background region 0 again. The transition is performed twice on one dimension, because the human body contains two kidneys. But in the first phase of the prediction, small objects greatly affected the location of each kidney region. Therefore, we made the following solutions by comparing the prediction results and actual labels in the training dataset.
(1) Collect statistics on the coordinates of non-zero positions in statz, x, and y.
(2) Compare the spacing between two adjacent coordinates. If the spacing of the two coordinates exceeds 15, the two coordinates are considered as the boundary of the two connected domains (that is, the kidney).
(3) Reserve 3-pixel redundancy for the prediction boundary of each axis.
The formula for this process is as follows:
index=where(diff(nonzero(stat))>15) (5)
index indicates a set of boundaries of two connected domains, stat indicates sum data of each dimension obtained in step 1, nonzero indicates coordinates of a non-zero position, diff indicates a difference between two adjacent coordinates, and where indicates a position that complies with a condition value.
It has been proved that the algorithm we designed is robust in ROI extraction during training and inference, and can efficiently obtain the distribution range of kidneys in each source image. After mapping the range to the source image and cropping the corresponding three-dimensional area, we can extract kidney ROIs.
Fine Segmentation of Kidney-Tumor Regions
In actuality, the extracted kidney ROIs in the previous step have different data sizes. Before the segmentation, three-dimensional ROI data needs to be separated from the depth dimension (that is, the z-axis) to form multiple two-dimensional images. Then the size of the two-dimensional images needs to be adjusted to 256 x 256 as the input data for fine segmentation.
The prediction results generated in this step are used as the final result after postprocessing. During the training, the batch size was set to 8 and the initial learning rate was set to 0.0003. After the training of 1500 batches, the learning rate was linearly increased to 0.001, and decreased to 0.00001 after 90 epochs according to the cosine learning rate policy. In addition, we used Hybrid-Dice loss as the loss function, which is calculated as follows:
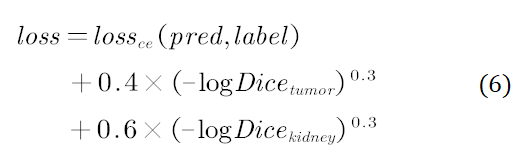
Hybrid-Dice loss maps linear Dice to a non-linear range, so that a loss change rate becomes larger when Dice approaches 0 and becomes smaller when Dice approaches 1. Furthermore, the loss stability can also be increased during the training to facilitate parameter update.
We compared the prediction results of U-Net, U-Net++[8], and U-Net3+[9] in our experiment, and the following table shows the result. According to the data in the table, due to the multi-scale information fusion, U-Net3+'s result of tumor prediction is significantly higher than those of the other two. Therefore, we finally used U-Net3+ to segment kidney and tumor regions.
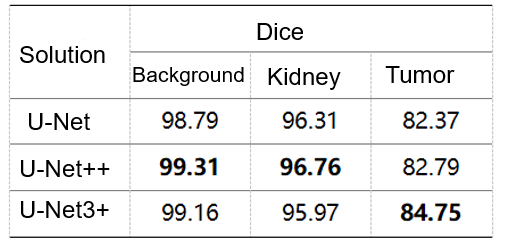
Table 2 Verified accuracy (note: data is obtained based on extracted ROIs of the validation dataset.)
Postprocessing of Segmentation Results
After the four steps, the model is able to segment the kidneys and tumors. But to get a higher accuracy, we need to further modify the details of segmentation results by using a morphological method and to pad small holes and remove small objects.
During the postprocessing, we first padded the tumor holes in the prediction results (region with the perdition result marked 2), and then calculated the total number of pixels of each connected tumor domain. After removing small objects whose total number of pixels is less than 20% of that of the largest connected domain, we obtained the final tumor prediction result. For parts that were predicted as kidneys, we used the same method.
04. Results
We recorded the prediction results of the 90 unlabeled test datasets provided by the KiTS19 dataset and uploaded the results to the KiTS19 server. Table 3 shows the final scores. The prediction score of kidneys is calculated by using the kidney region 1 and tumor region 2 as foreground and other regions as background, which is the same as the evaluation method used in this contest.
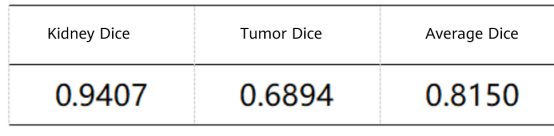
Table 3 Results of the proposed method on the KiTS19 test dataset
The results demonstrate that our method can effectively segment the regions of kidneys and tumors from abdominal CT scanning images. Thanks to this high performance, we won the third prize in the competition.
05. Summary and Prospect
Though our method, which combines 3D U-Net rough segmentation and U-Net3+ fine segmentation, achieves good outcomes, it does not involve in-depth ablation studies on these two stages. This method may not be the optimal one for the KiTS19 dataset, but it achieves excellent outcomes in our training model. However, large-scale hyperparameter tuning is required to strictly compare the aforementioned solutions.
Recent advancements in semantic segmentation have indicated that incorporating residual connections and attention modules into the convolution layer can significantly enhance model performance. This approach appears to be a viable solution for improving overall model performance. Besides, multi-model ensemble learning is frequently used in contests. In our two-stage method, the fine segmentation process in the second phase relies on the segmentation results generated in the first phase. Therefore, ensembling segmentation results of the first phase to improve the accuracy of kidney ROI extraction may be an important way to improve our method performance.
Reference
[1] Heller N, Sathianathen N, Kalapara A, et al. The kits19 challenge data: 300 kidney tumor cases with clinical context, ct semantic segmentations, and surgical outcomes[J]. arXiv preprint arXiv:1904.00445, 2019.
[2] Zheng R, Zhang S, Zeng H, et al. Cancer incidence and mortality in China, 2016[J]. Journal of the National Cancer Center, 2022, 2(1): 1-9.
[3] 2022 CCF MindSpore-based Kidney-Tumor Segmentation
https://www.datafountain.cn/competitions/588
[4] Ronneberger O, Fischer P, Brox T. U-net: Convolutional networks for biomedical image segmentation[C]//International Conference on Medical image computing and computer-assisted intervention. Springer, Cham, 2015: 234-241.
[5] Çiçek Ö, Abdulkadir A, Lienkamp S S, et al. 3D U-Net: learning dense volumetric segmentation from sparse annotation[C]//International conference on medical image computing and computer-assisted intervention. Springer, Cham, 2016: 424-432.
[6] https://github.com/junqiangchen/KiTS19-Challege
[7] Milletari F, Navab N, Ahmadi S A. V-net: Fully convolutional neural networks for volumetric medical image segmentation[C]//2016 fourth international conference on 3D vision (3DV). IEEE, 2016: 565-571.
[8] Zhou Z, Siddiquee M M R, Tajbakhsh N, et al. Unet++: Redesigning skip connections to exploit multiscale features in image segmentation[J]. IEEE transactions on medical imaging, 2019, 39(6): 1856-1867.
[9 ]Huang H, Lin L, Tong R, et al. Unet 3+: A full-scale connected unet for medical image segmentation[C]//ICASSP 2020-2020 IEEE International Conference on Acoustics, Speech and Signal Processing (ICASSP). IEEE, 2020: 1055-1059.