Tensor Visualization Design
![]()
Background
Tensor visualization helps you intuitively view the tensor values during training. The tensor change trend can be displayed in a histogram, and the tensor value of a step can also be viewed. Tensor includes the weight value, gradient value, and activation value.
Overall Design
Tensor visualization mainly refers to parsing a summary file generated by the tensor data which is recorded by the TensorSummary API of MindSpore, and returning the result to the frontend for display.
MindSpore Insight parses tensor data based on a .proto file (Google Protocol Buffer, which is an efficient and convenient structured data storage mode) and caches the data. When specific data is queried at the frontend, the data is returned to the frontend for display.
Tensor visualization supports the display of 1-dimensional to N-dimensional tensors in tables or histograms. The 0-dimensional tensors need to be recorded and displayed in scalar visualization through ScalarSummary.
In the table view, you can query the tensor data of a specific step in the cache. The backend enables you to query the tensor data of any 0 to 2 dimensions at a time through slice.
In the histogram view, you can query the histogram data of all steps in the cache.
Backend Design
The TensorContainer, Histogram, and TensorProcessor classes are involved in tensor visualization. The TensorContainer class is used to store information such as the specific value, dimension, data type, maximum value, minimum value, and histogram (references the data of Histogram) of a tensor. Histogram is used to process histogram information, including saving the number of buckets and normalizing histogram data of all steps in the cache. TensorProcessor is used to process tensor-related HTTP requests, including obtaining a specific training job in the cache, the number of steps in a specific tag, tensor statistics of each step, tensor data of a specific dimension in a specific step (a maximum of two dimensions can be queried at a time), and the histogram data of a specific tag.
Frontend Design
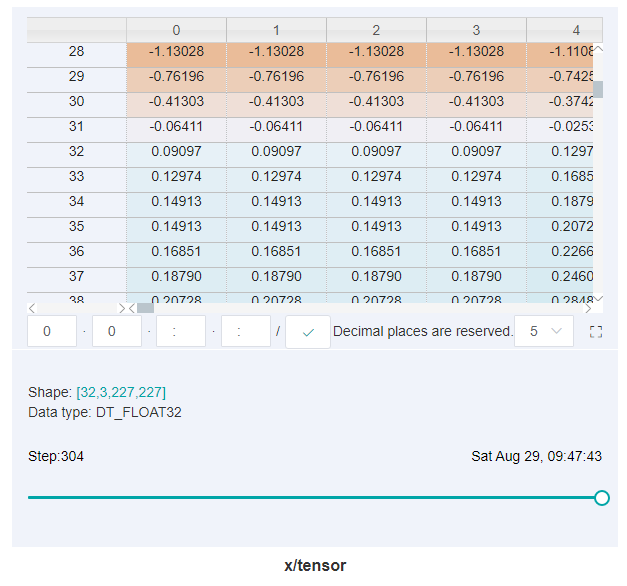
Figure 1: Table view
Figure 1 displays tensors recorded by a user in a form of a table. The following functions are included:
The input boxes under the table display the tensor data of the current dimension. The colon (:) indicates index range of the current dimension which is basically the same as the meaning of Python index. If no specific index is specified, it indicates all the values of the current dimension and
2:5indicates the value of index from 2 to 5 (not including 5). You can enter the corresponding index in the box or use index range containing:to query tensor data in a specific dimension.Drag the thumb of the linear slider below the table to query the tensor data of a specific step.
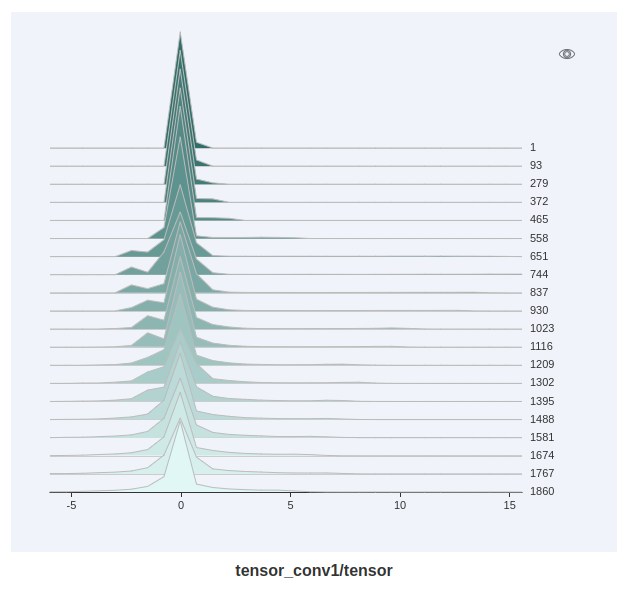
Figure 2: Histogram view
Figure 2 shows tensors recorded by a user in a form of a histogram.
API Design
In tensor visualization, there are file API and RESTful API. The file API is the summary.proto file, which is used for data interconnection between MindSpore Insight and MindSpore. RESTful API is an internal API used for data interaction between the MindSpore Insight frontend and backend.
File API Design
The summary.proto file is the main entry. TensorProto data is stored in the summary value, as shown in the following:
{
    message Summary {
        message Image {
            // Dimensions of the image.
            required int32 height = 1;
            required int32 width = 2;
            ...
        }

        message Histogram {
          message bucket{
              // Counting number of values fallen in [left, left + width).
              // For the rightmost bucket, the range is [left, left + width].
              required double left = 1;
              required double width = 2;
              required int64 count = 3;
          }

          repeated bucket buckets = 1;
          ...
        }

        message Value {
            // Tag name for the data.
            required string tag = 1;

            // Value associated with the tag.
            oneof value {
                float scalar_value = 3;
                Image image = 4;
                TensorProto tensor = 8;
                Histogram histogram = 9;
            }
        }

    // Set of values for the summary.
    repeated Value value = 1;
}
TensorProto is defined in the anf_ir.proto file.